The AI SDK by Vercel is a powerful open-source library for building AI-powered applications, user interfaces, and agents in TypeScript.
This guide will walk you through building a Node.js application with TypeScript that uses the AI SDK to connect with the Gemini API via the Google Generative AI Provider and perform automated market trend analysis. The final application will:
- Use Gemini with Google Search to research current market trends.
- Extract structured data from the research to generate charts.
- Combine the research and charts into a professional HTML report and save it as a PDF.
Prerequisites
To complete this guide, you'll need:
- A Gemini API key. You can create one for free in Google AI Studio.
- Node.js version 18 or later.
- A package manager, such as
npm,pnpm, oryarn.
Set up your application
First, create a new directory for your project and initialize it.
npm
mkdir market-trend-appcd market-trend-appnpm init -y
pnpm
mkdir market-trend-appcd market-trend-apppnpm init
yarn
mkdir market-trend-appcd market-trend-appyarn init -y
Install dependencies
Next, install the AI SDK, the Google Generative AI provider, and other necessary dependencies.
npm
npm install ai @ai-sdk/google zodnpm install -D @types/node tsx typescript && npx tsc --init
To prevent a TypeScript compiler error, comment out the following line in
the generated tsconfig.json:
//"verbatimModuleSyntax": true,
pnpm
pnpm add ai @ai-sdk/google zodpnpm add -D @types/node tsx typescript
yarn
yarn add ai @ai-sdk/google zodyarn add -D @types/node tsx typescript && yarn tsc --init
To prevent a TypeScript compiler error, comment out the following line in
the generated tsconfig.json:
//"verbatimModuleSyntax": true,
This application will also use the third-party packages Puppeteer and Chart.js for rendering charts and creating a PDF:
npm
npm install puppeteer chart.jsnpm install -D @types/chart.js
pnpm
pnpm add puppeteer chart.jspnpm add -D @types/chart.js
yarn
yarn add puppeteer chart.jsyarn add -D @types/chart.js
The puppeteer package requires running a script to download the Chromium
browser. Your package manager may ask for approval, so ensure you approve the
script when prompted.
Configure your API key
Set the GOOGLE_GENERATIVE_AI_API_KEY environment variable with your Gemini API
key. The Google Generative AI Provider automatically looks for your API key in
this environment variable.
MacOS/Linux
export GOOGLE_GENERATIVE_AI_API_KEY="YOUR_API_KEY_HERE"Powershell
setx GOOGLE_GENERATIVE_AI_API_KEY "YOUR_API_KEY_HERE"Create your application
Now, let's create the main file for our application. Create a new file named
main.ts in your project directory. You'll build up the logic in this file
step-by-step.
For a quick test to ensure everything is set up correctly, add the following
code to main.ts. This basic example uses generateText to get a simple
response from Gemini.
import { google } from "@ai-sdk/google";
import { generateText } from "ai";

async function main() {
  const { text } = await generateText({
    model: google("gemini-3.6-flash"),
    prompt: 'What is plant-based milk?',
  });

  console.log(text);
}

main().catch(console.error);
Before adding more complexity, run this script to verify that your environment is configured correctly. Run the following command in your terminal:
npm
npx tsc && node main.jspnpm
pnpm tsx main.tsyarn
yarn tsc && node main.jsIf everything is set up correctly, you'll see Gemini's response printed to the console.
Perform market research with Google Search
To get up-to-date information, you can enable the Google Search tool for Gemini. When this tool is active, the model can search the web to answer the prompt and will return the sources it used.
Replace the content of main.ts with the following code to perform the first
step of our analysis.
import { google } from "@ai-sdk/google";
import { generateText } from "ai";

async function main() {
  // Step 1: Search market trends
  const { text: marketTrends, sources } = await generateText({
    model: google("gemini-3.6-flash"),
    tools: {
      google_search: google.tools.googleSearch({}),
    },
    prompt: `Search the web for market trends for plant-based milk in North America for 2024-2025.
          I need to know the market size, key players and their market share, and primary consumer drivers.
          `,
  });

  console.log("Market trends found:\n", marketTrends);
  // To see the sources, uncomment the following line:
  // console.log("Sources:\n", sources);
}

main().catch(console.error);
Extract chart data
Next, let's process the research text to extract structured data suitable for
charts. Use the AI SDK's generateObject function along with a zod
schema to define the exact data structure.
Also create a helper function to convert this structured data into a
configuration that Chart.js can understand.
Add the following code to main.ts. Note the new imports and the added "Step 2".
import { google } from "@ai-sdk/google";
import { generateText, generateObject } from "ai";
import { z } from "zod/v4";
import { ChartConfiguration } from "chart.js";

// Helper function to create Chart.js configurations
function createChartConfig({labels, data, label, type, colors,}: {
  labels: string[];
  data: number[];
  label: string;
  type: "bar" | "line";
  colors: string[];
}): ChartConfiguration {
  return {
    type: type,
    data: {
      labels: labels,
      datasets: [
        {
          label: label,
          data: data,
          borderWidth: 1,
          ...(type === "bar" && { backgroundColor: colors }),
          ...(type === "line" && colors.length > 0 && { borderColor: colors[0] }),
        },
      ],
    },
    options: {
      animation: { duration: 0 }, // Disable animations for static PDF rendering
    },
  };
}

async function main() {
  // Step 1: Search market trends
  const { text: marketTrends, sources } = await generateText({
    model: google("gemini-3.6-flash"),
    tools: {
      google_search: google.tools.googleSearch({}),
    },
    prompt: `Search the web for market trends for plant-based milk in North America for 2024-2025.
          I need to know the market size, key players and their market share, and primary consumer drivers.
          `,
  });

  console.log("Market trends found.");

  // Step 2: Extract chart data
  const { object: chartData } = await generateObject({
    model: google("gemini-3.6-flash"),
    schema: z.object({
      chartConfigurations: z
        .array(
          z.object({
            type: z.enum(["bar", "line"]).describe('The type of chart to generate. Either "bar" or "line"',),
            labels: z.array(z.string()).describe("A list of chart labels"),
            data: z.array(z.number()).describe("A list of the chart data"),
            label: z.string().describe("A label for the chart"),
            colors: z.array(z.string()).describe('A list of colors to use for the chart, e.g. "rgba(255, 99, 132, 0.8)"',),
          }),
        )
        .describe("A list of chart configurations"),
    }),
    prompt: `Given the following market trends text, come up with a list of 1-3 meaningful bar or line charts
    and generate chart data.

Market Trends:
${marketTrends}
`,
  });

  const chartConfigs = chartData.chartConfigurations.map(createChartConfig);

  console.log("Chart configurations generated.");
}

main().catch(console.error);
Generate the final report
In the final step, instruct Gemini to act as an expert report writer. Provide it with the market research, the chart configurations, and a clear set of instructions for building an HTML report. Then, use Puppeteer to render this HTML and save it as a PDF.
Add the final puppeteer import and "Step 3" to your main.ts file.
// ... (imports from previous step)
import puppeteer from "puppeteer";

// ... (createChartConfig helper function from previous step)

async function main() {
  // ... (Step 1 and 2 from previous step)

  // Step 3: Generate the final HTML report and save it as a PDF
  const { text: htmlReport } = await generateText({
    model: google("gemini-3.6-flash"),
    prompt: `You are an expert financial analyst and report writer.
    Your task is to generate a comprehensive market analysis report in HTML format.

    **Instructions:**
    1.  Write a full HTML document.
    2.  Use the provided "Market Trends" text to write the main body of the report. Structure it with clear headings and paragraphs.
    3.  Incorporate the provided "Chart Configurations" to visualize the data. For each chart, you MUST create a unique <canvas> element and a corresponding <script> block to render it using Chart.js.
    4.  Reference the "Sources" at the end of the report.
    5.  Do not include any placeholder data; use only the information provided.
    6.  Return only the raw HTML code.

    **Chart Rendering Snippet:**
    Include this script in the head of the HTML: <script src="https://cdn.jsdelivr.net/npm/chart.js"></script>
    For each chart, use a structure like below, ensuring the canvas 'id' is unique for each chart, and apply the correspinding config:

    ---
    <div style="width: 800px; height: 600px;">
      <canvas id="chart1"></canvas>
    </div>
    <script>
      new Chart(document.getElementById('chart1'), config);
    </script>
    ---
    (For the second chart, use 'chart2' and the corresponding config, and so on.)

    **Data:**
    - Market Trends: ${marketTrends}
    - Chart Configurations: ${JSON.stringify(chartConfigs)}
    - Sources: ${JSON.stringify(sources)}
    `,
  });

  // LLMs may wrap the HTML in a markdown code block, so strip it.
  const finalHtml = htmlReport.replace(/^```html\n/, "").replace(/\n```$/, "");

  const browser = await puppeteer.launch();
  const page = await browser.newPage();
  await page.setContent(finalHtml);
  await page.pdf({ path: "report.pdf", format: "A4" });
  await browser.close();

  console.log("\nReport generated successfully: report.pdf");
}

main().catch(console.error);
Run your application
You are now ready to run the application. Execute the following command in your terminal:
npm
npx tsc && node main.jspnpm
pnpm tsx main.tsyarn
yarn tsc && node main.jsYou will see logging in your terminal as the script executes each step.
Once complete, a report.pdf file containing your market analysis will be
created in your project directory.
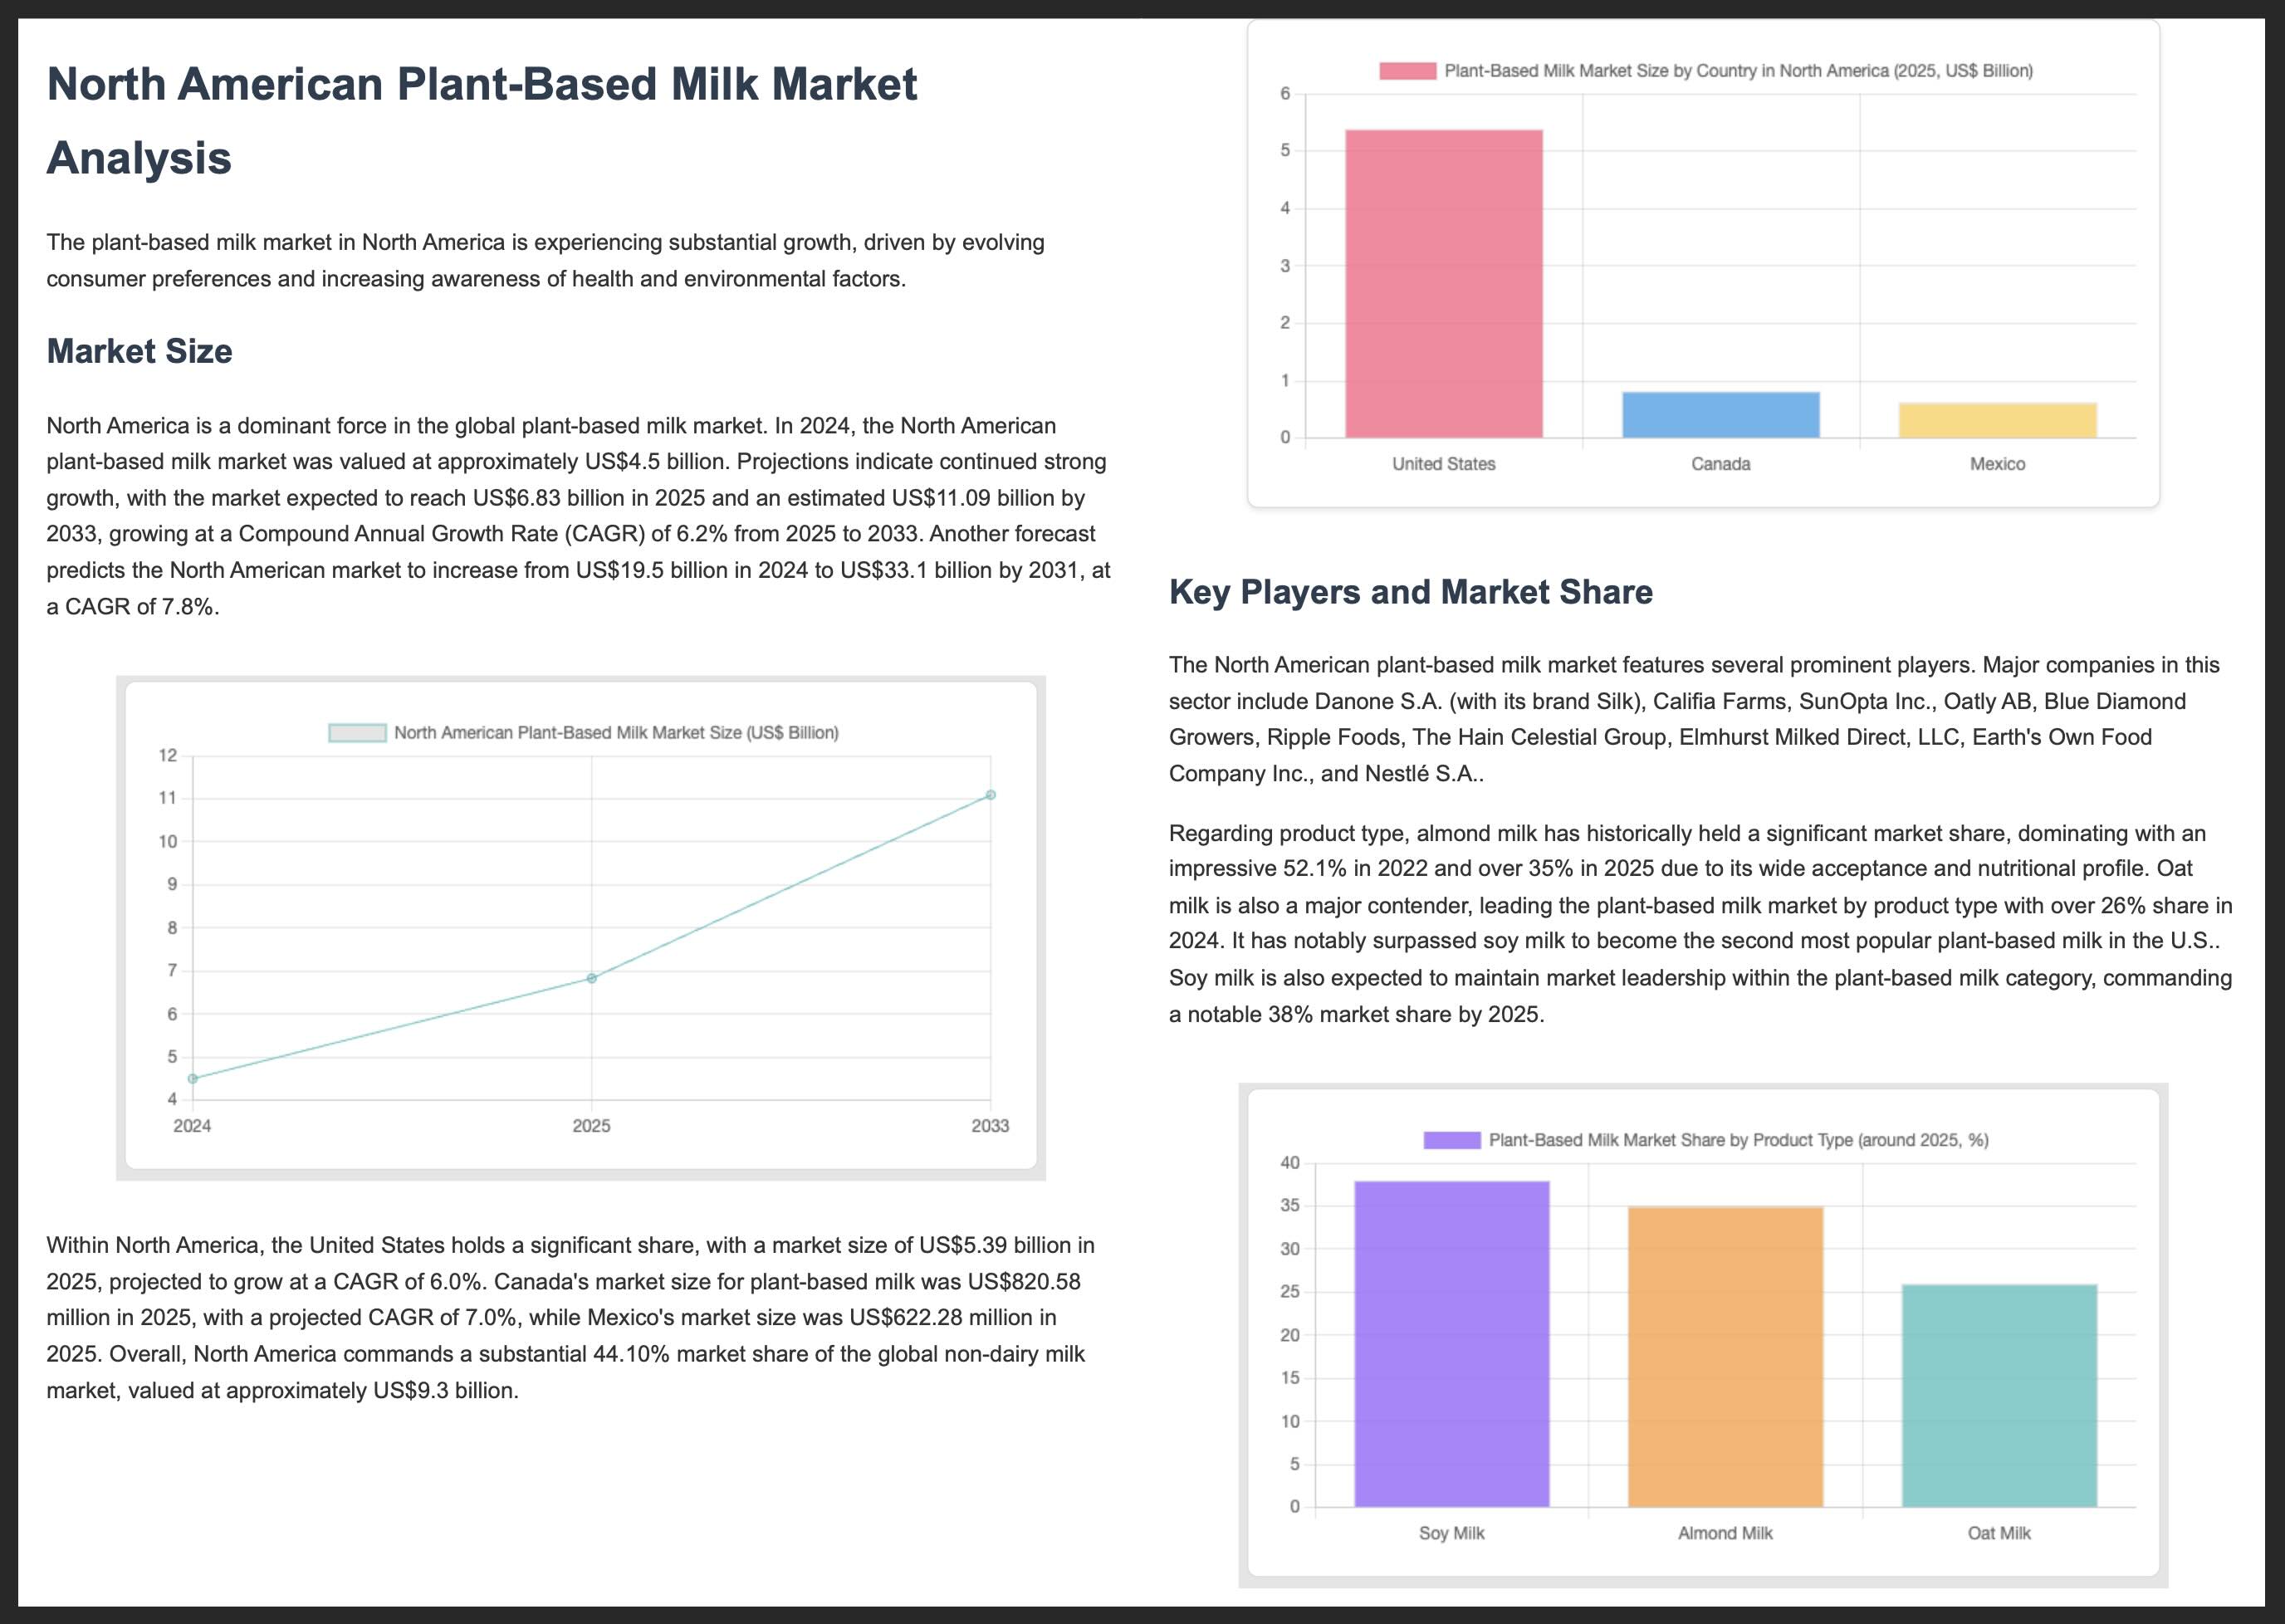
Below, you'll see the first two pages of an example PDF report:
Further resources
For more information about building with Gemini and the AI SDK, explore these resources: